当前不少网友咨询小编关于谷歌浏览器(Google Chrome)查看请求头的操作,而在这笔者就专门带来了谷歌浏览器(Google Chrome)查看请求头的方法,相信对大家会有所帮助的。
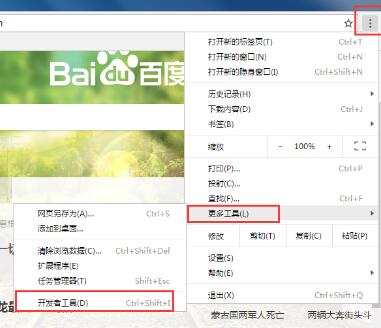
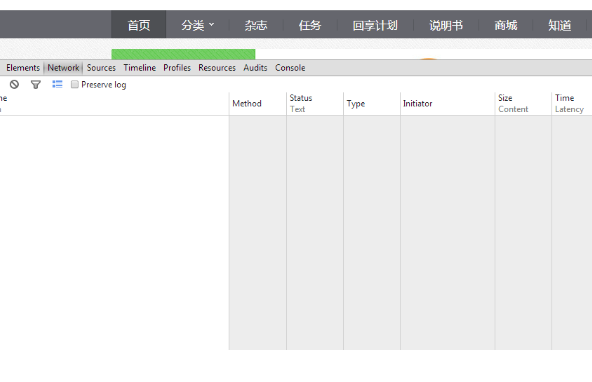
1、打开谷歌浏览器(Google Chrome),在其右上角的菜单里找到“开发者工具”并打开;
2、找到Network选项框。以百度页面为例,点击任务选框来查看网络请求流;
3、在Network框中会有所有的请求流;
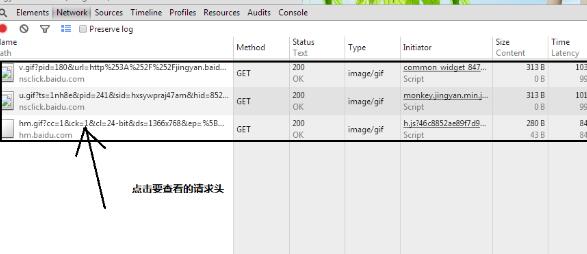
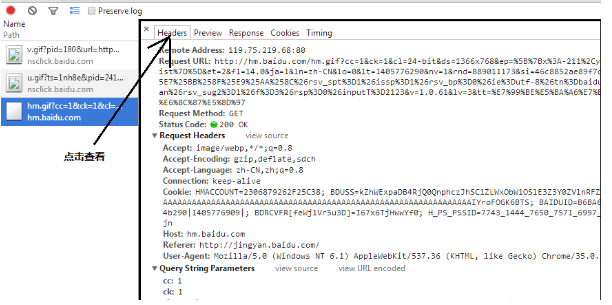
4、点击自己所需要的请求流,查看头部信息。
以上这里为各位分享了谷歌浏览器(Google Chrome)查看请求头的方法。有需要的朋友赶快来看看本篇文章吧。